Next: 5 Algorithmic Aspects of Up: Visualizing Data from Time-Dependent Previous: 3 Interpolating Adaptive Data
![]()
![]()
![]()
Next: 5 Algorithmic Aspects of Up:
Visualizing Data from Time-Dependent Previous:
3 Interpolating Adaptive Data
Integration techniques such as particle tracing or stream surfaces are powerful methods helping to understand global aspects of a CFD simulation. They calculate the transport of certain point sets in the velocity field. Such methods again fit in our concept of dynamic process: We calculate time-objects, where objects are single particles, clouds of points, curves or surfaces. The initial objects just examined are released interactively by picking or positioning. The corresponding dynamic processes are lines in space-time or lists of time-steps of clouds, curves etc. In general, the step length of the actually stored evolution may be much larger than the step length of the integration scheme.

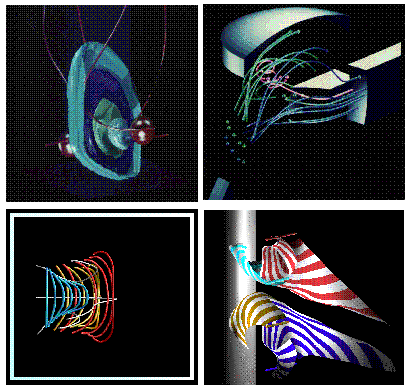
Figure 5: Different extracted
dynamic processes with different display styles: The deformation of test spheres
starting at two inlets and splashing against each other, particle traces in a
two stroke engine, moving curves in a flow volume, stream surfaces displaying
the evolution of curves in the flow behind a cylindric obstacle.
Depending on the curvature of the transported curves and surfaces, their discretization has to be locally adapted. Now, the integration machinery runs analogue to the numerical scheme presented in section 3. A "get-object" message will cause the extracted processes to procure the transported test sets at the current time. Thus the new processes gained by integration can be examined interactively in quite a similar way as the numerical data itself (see section 2).
Furtheron, drawing particle paths or stream surfaces is only a specific display method on the extracted processes themselves. Depending on two parameters, an end time and a start time, the trace of the evolution in between this time interval can be visualized. The method needed for the meshing of a stream surface picks up ideas already presented in [18] to generate a triangulation joining the polygon lines of two time steps.
![]()
![]()
![]()
Next: 5 Algorithmic Aspects of Up:
Visualizing Data from Time-Dependent Previous:
3 Interpolating Adaptive Data